
KIT.X Add-ons for LabVIEW
KIT.X Add-ons for LabVIEW

Circular Chart Base
A flexible and easy way to create high quality circular charts with features such as anti-aliased and translucence, helps you to deal with the boring and time-consuming drawing details.

Features
- Chart Types : Supports multiple types of charts, e.g. , pie chart, doughnut chart, polar area chart, circular bar chart, circular slide, graduated gauge chart.
- Chart Elements : Multiple types of chart elements can be added to the chart, e.g. , legend, scale, grid, slider, digital, decoration.
- Slice Modes : Three modes for different overlapping and connecting relationships between slices.
- Customizable : Most properties of chart objects are customizable.
- Reusing & Sharing : Charts can export images for reporting, and their styles can also be saved as files for reusing and sharing.
- Quick-Start : Easy to use, and you can quick-start your development based on several build-in styles.

How to Use
- Single Control : The Circular Chart Add-On is ultimately defined as a single control.
- Chart Styles : Being edited or loaded with different styles, the chart can be presented in the different types listed above, or even more.
- Style Designer : The chart style is configured by the Chart Style Designer dialog box, which can be displayed through the right-click menu of the chart, similar to the Properties dialog box of the LabVIEW controls.
- Auto Reload : After configured, the style can be saved into the chart instance in your VI and automatically reloaded the next time.
- Data Type : The data type of the chart is 2-D array of SGL numeric. Each row of the array corresponds to a slice in turn, and each column corresponds to a slice parameter you specify in the Chart Style Designer, the available slice parameters include start angle, end angle, inner radius, and outer radius.


Features
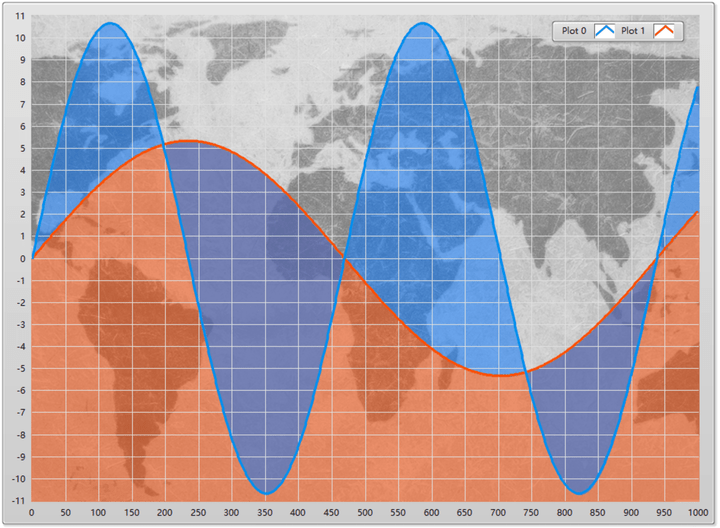
- The grid lines are not covered
- The translucent areas show the curve overlapping more clearly
- The graph can also have a better appearance.
How to Use
As the single VI in this tool, the Plot Area Filling VI creates a filled plot area image and inserts it into the background of the graph.
It needs to be called when you change the graph value or some other relevant properties.

More Are Coming . . .
Contact Us
If you have any question, comment or suggestion, please contact us without hesitation.
We'll respond as soon as possible.


